In today’s competitive restaurant market, offering discounts is not just a perk — it’s a smart way to attract and retain customers. That’s why Etable gives you a flexible Coupons feature…
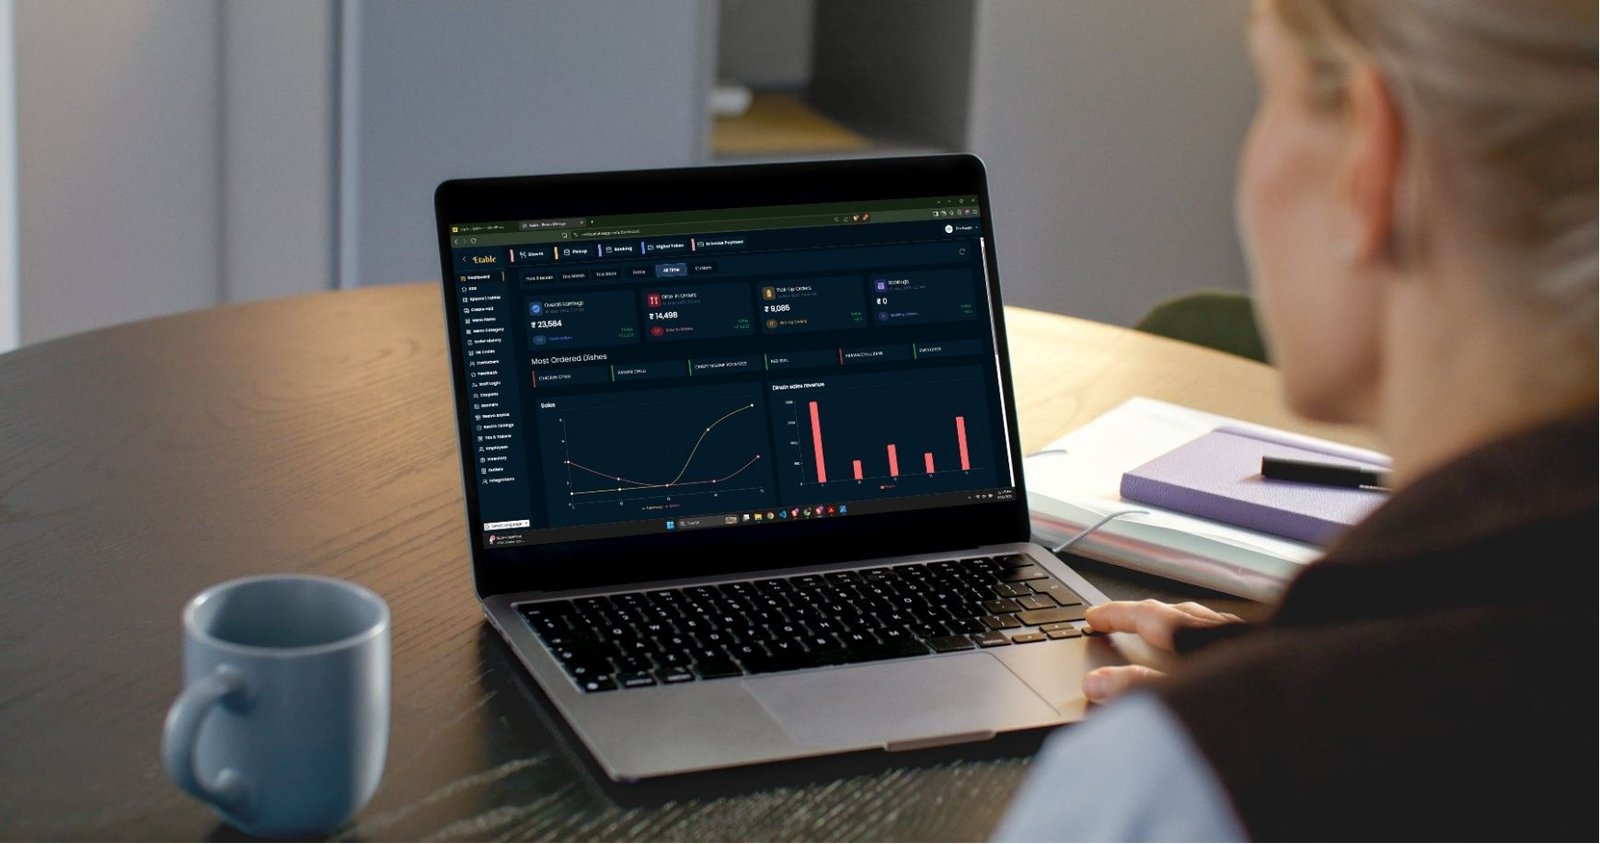
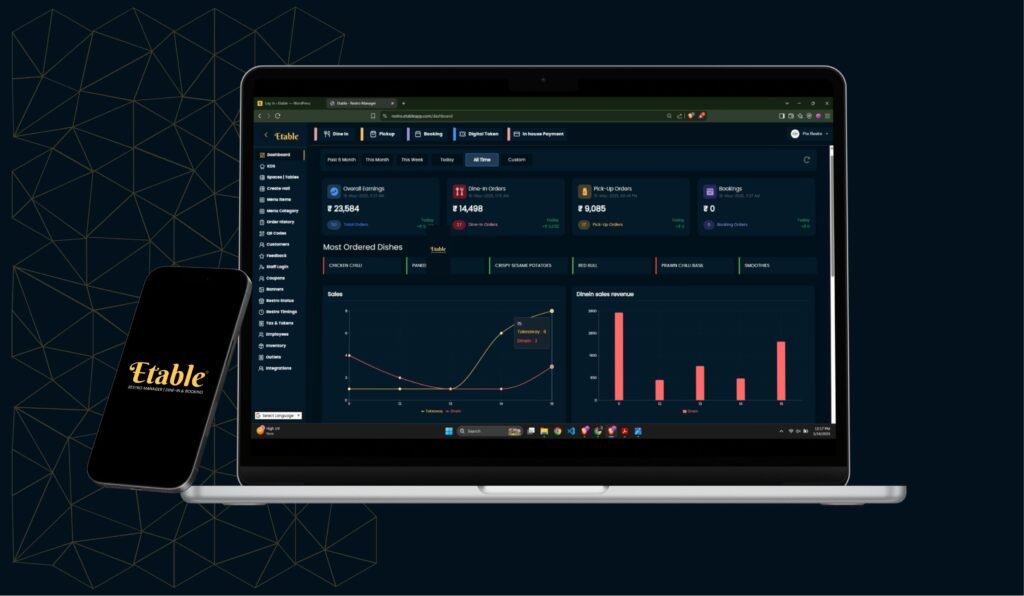
Running a successful restaurant requires a clear overview of daily operations—and that’s exactly what a restaurant dashboard offers. With Etable’s restaurant dashboard, you can track dine-in orders, manage bookings, monitor payments, and analyze sales—all in real time.
Real-Time Dine-In Data on Your Restaurant Dashboard
To start with, your dine-in orders are clearly displayed in the top panel. For example, you can instantly see how many orders were placed, the earnings from those orders, and how many were served today. Additionally, this helps track peak hours and staff performance, allowing you to plan better and serve faster.
Manage Pickup Orders with the Restaurant Dashboard
Furthermore, pickup orders are shown separately in a yellow-highlighted box. This way, you can quickly track the number of takeaway orders and their revenue. As a result, managing peak takeaway hours becomes smoother and more efficient, especially during weekends or rush times.
Use the Restaurant Dashboard for Easy Table Bookings
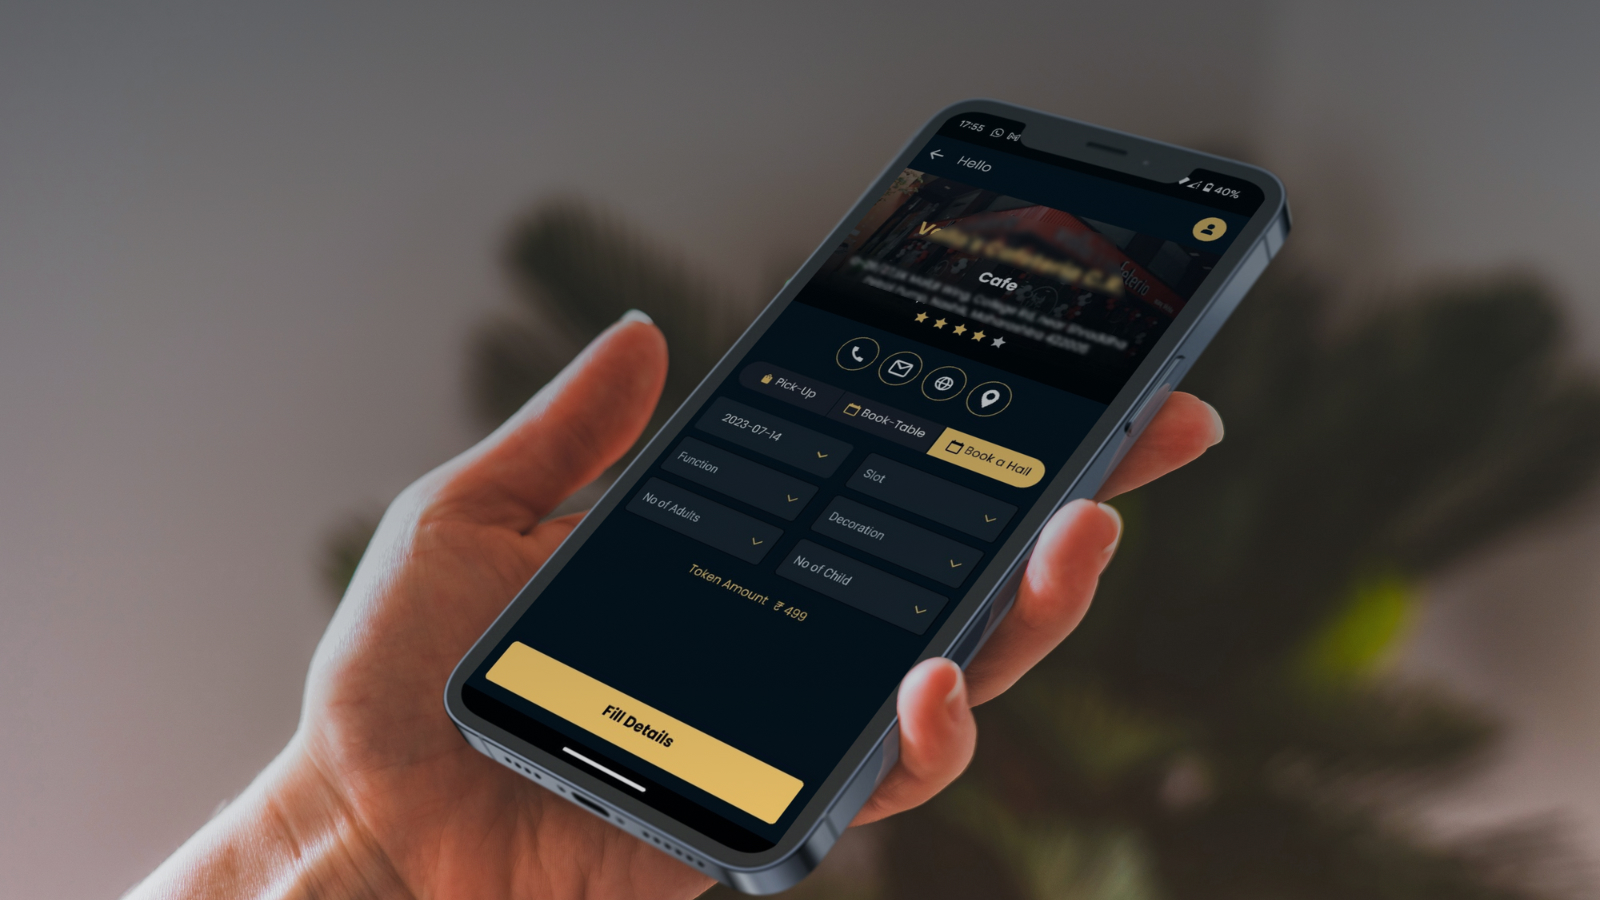
In addition, the violet section is dedicated to table and hall bookings. Whether it’s a regular table reservation or a large event booking, all the data is available at a glance. Therefore, your staff can prepare in advance, reducing the risk of overbooking and improving overall guest satisfaction.
Digital Tokens – Avoid Crowd & Save Time
Moreover, Etable’s digital token system allows customers to join a virtual queue. Consequently, your team can manage busy periods without overcrowding the entrance. Most importantly, this feature ensures fair turn-taking and enhances the customer experience, even on the busiest days.
In-House Payments – Keep Finances Clear
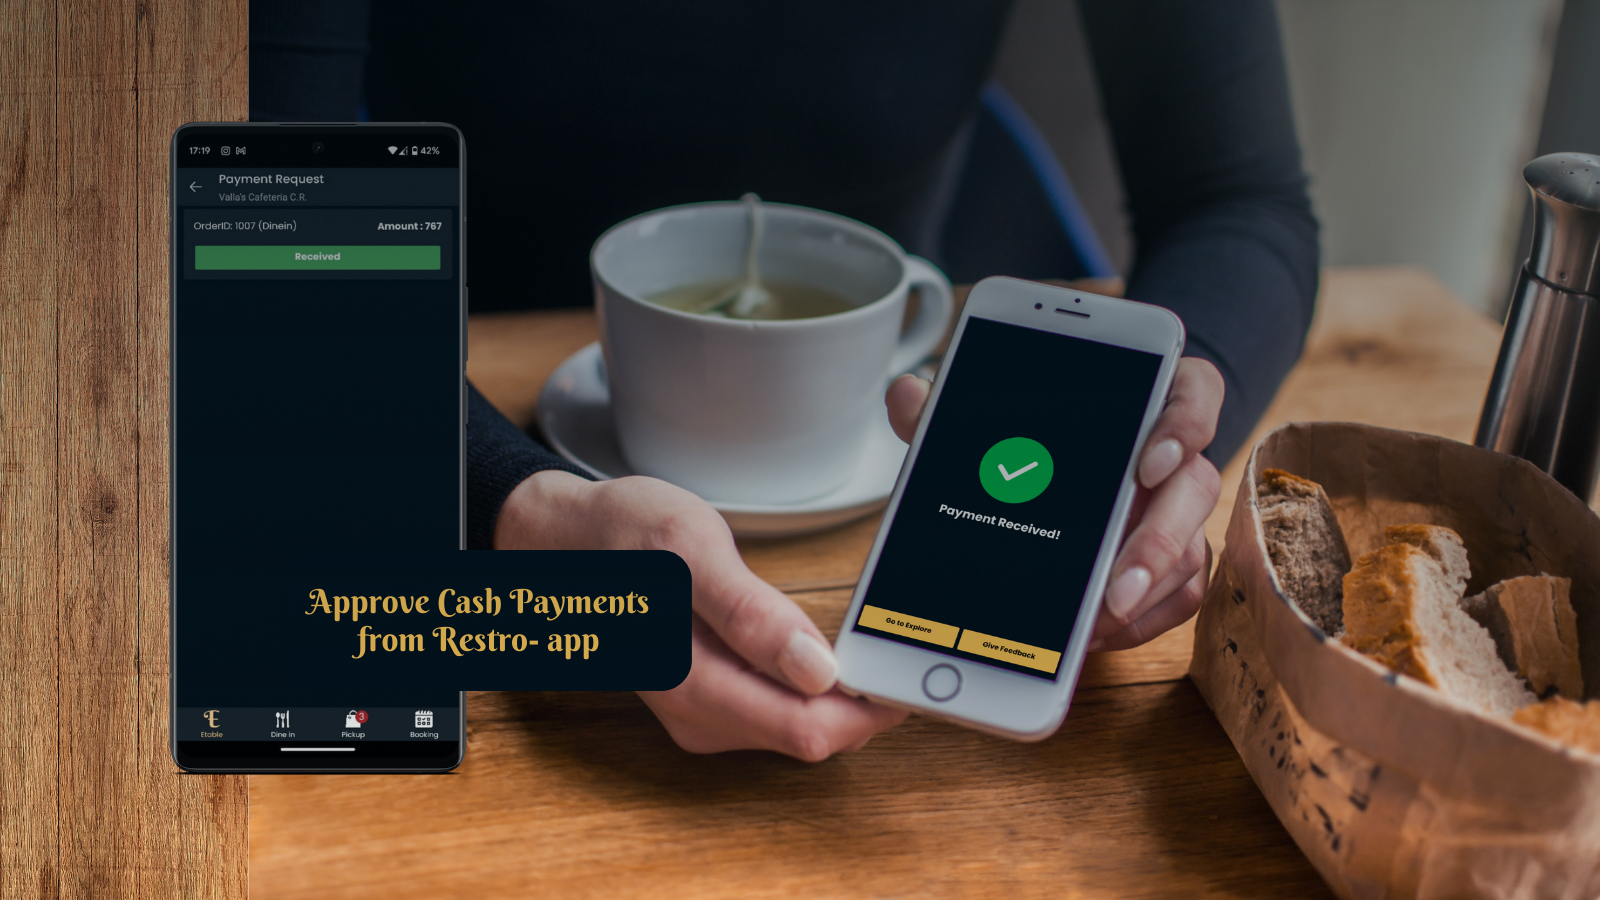
Similarly, the dashboard tracks in-house payments via UPI, card, or cash. As a result, your accounts stay organized and transparent. Meanwhile, staff can close bills faster, which enhances service speed and reduces customer waiting time.
Flexible Filters – Customize Your View
With Etable, you can filter performance reports by Today, This Week, This Month, Past 6 Months, or All Time. This flexibility lets you monitor trends and make data-driven decisions quickly. In other words, it becomes easier to adapt and grow your restaurant based on real insights.
Restaurant Dashboard Summary – View Earnings in One Glance
Notably, the dashboard summarizes all earnings and orders in one place. Specifically, it shows:
Overall Earnings – Total revenue across services
Dine-In Orders – Table service income
Pickup Orders – Takeaway revenue
Booking Revenue – Income from hall and table bookings
Total Orders – Completed transactions
This compact view saves time and improves reporting accuracy at a glance.
Color-Coded UI – Simple and Intuitive
For added clarity, each service type is color-coded:
Maroon for Dine-In Orders
Yellow for Pickup Orders
Violet for Booking Orders
These visual cues appear throughout the dashboard—on earnings, graphs, and reports—making everything easy to identify. As a result, there’s less confusion and better navigation.
Most Ordered Dishes – Know What Works
Equally important, knowing what your guests love the most helps your kitchen plan better. For instance, top dishes like Paneer Chilli or Chicken Tikka are highlighted. This information allows you to stock ingredients efficiently and promote bestsellers strategically.
Visual Sales Graph – Track Growth at a Glance
Below the order data, you’ll see a visual sales graph breaking down performance by order type. Thus, you get a quick look at busy hours and dips in orders. Over time, this helps adjust staff shifts and optimize kitchen prep.
GST Report – Auto Calculated for You
Importantly, Etable’s dashboard automatically calculates:
SGST
CGST
Total GST
Furthermore, you can export the GST data, which simplifies tax filing. This reduces errors and saves time during audits.
Revenue Breakdown on Your Restaurant Dashboard
Want to know which service earns the most? The dashboard breaks revenue into:
Dine-In Sales
Pickup Sales
Table Bookings
Hall Bookings
Hall Booking Revenue
Therefore, you can plan marketing, staff allocation, and promotions based on actual performance.
Track Smarter, Serve Better – Optimize Your Restaurant Growth with Etable Analytics
To begin with, Etable Analytics provides a clear picture of your restaurant’s performance through real-time sales tracking, customer behavior insights, and outlet comparisons. With just a few clicks, you can review daily sales, order values, and food trends. As a result, this helps you make faster, data-driven decisions and refine your operations for better efficiency.
Moreover, Etable Analytics empowers you to understand your guests more deeply. You can analyze order patterns, customer preferences, and dining frequency. Consequently, it becomes easier to run targeted campaigns, plan menus more effectively, and improve your service strategy over time. Whether you’re managing a single outlet or multiple branches, this powerful tool helps you grow with confidence.
Final Thoughts – Why You Need the Etable Restaurant Dashboard
In conclusion, Etable’s restaurant dashboard is your smart assistant. It helps manage everything from order tracking to tax reporting—all in one place. With color-coded sections, real-time updates, and an easy-to-read layout, you can take better decisions, save time, and grow your restaurant faster.
👉 Ready to simplify your operations?
Visit etable.co.in and explore the power of smart restaurant management today.
